this is the english version of Raspberry PI Carbon App
Intro
In K8S Blog we have discussed topics around Sustainable Computing and Green IT. We measured energy production in realtime and constructed use cases for Kubernetes workload. Now we want to use this data privacy at our home to switch on or off the washing machine sustainable or postponed in time the iron session where we have enough eco energy, for example. To not setup a complate smart home equipement we only need a visualization like a clock or thermometer to determine the eco balance,in short: the energy ampel!
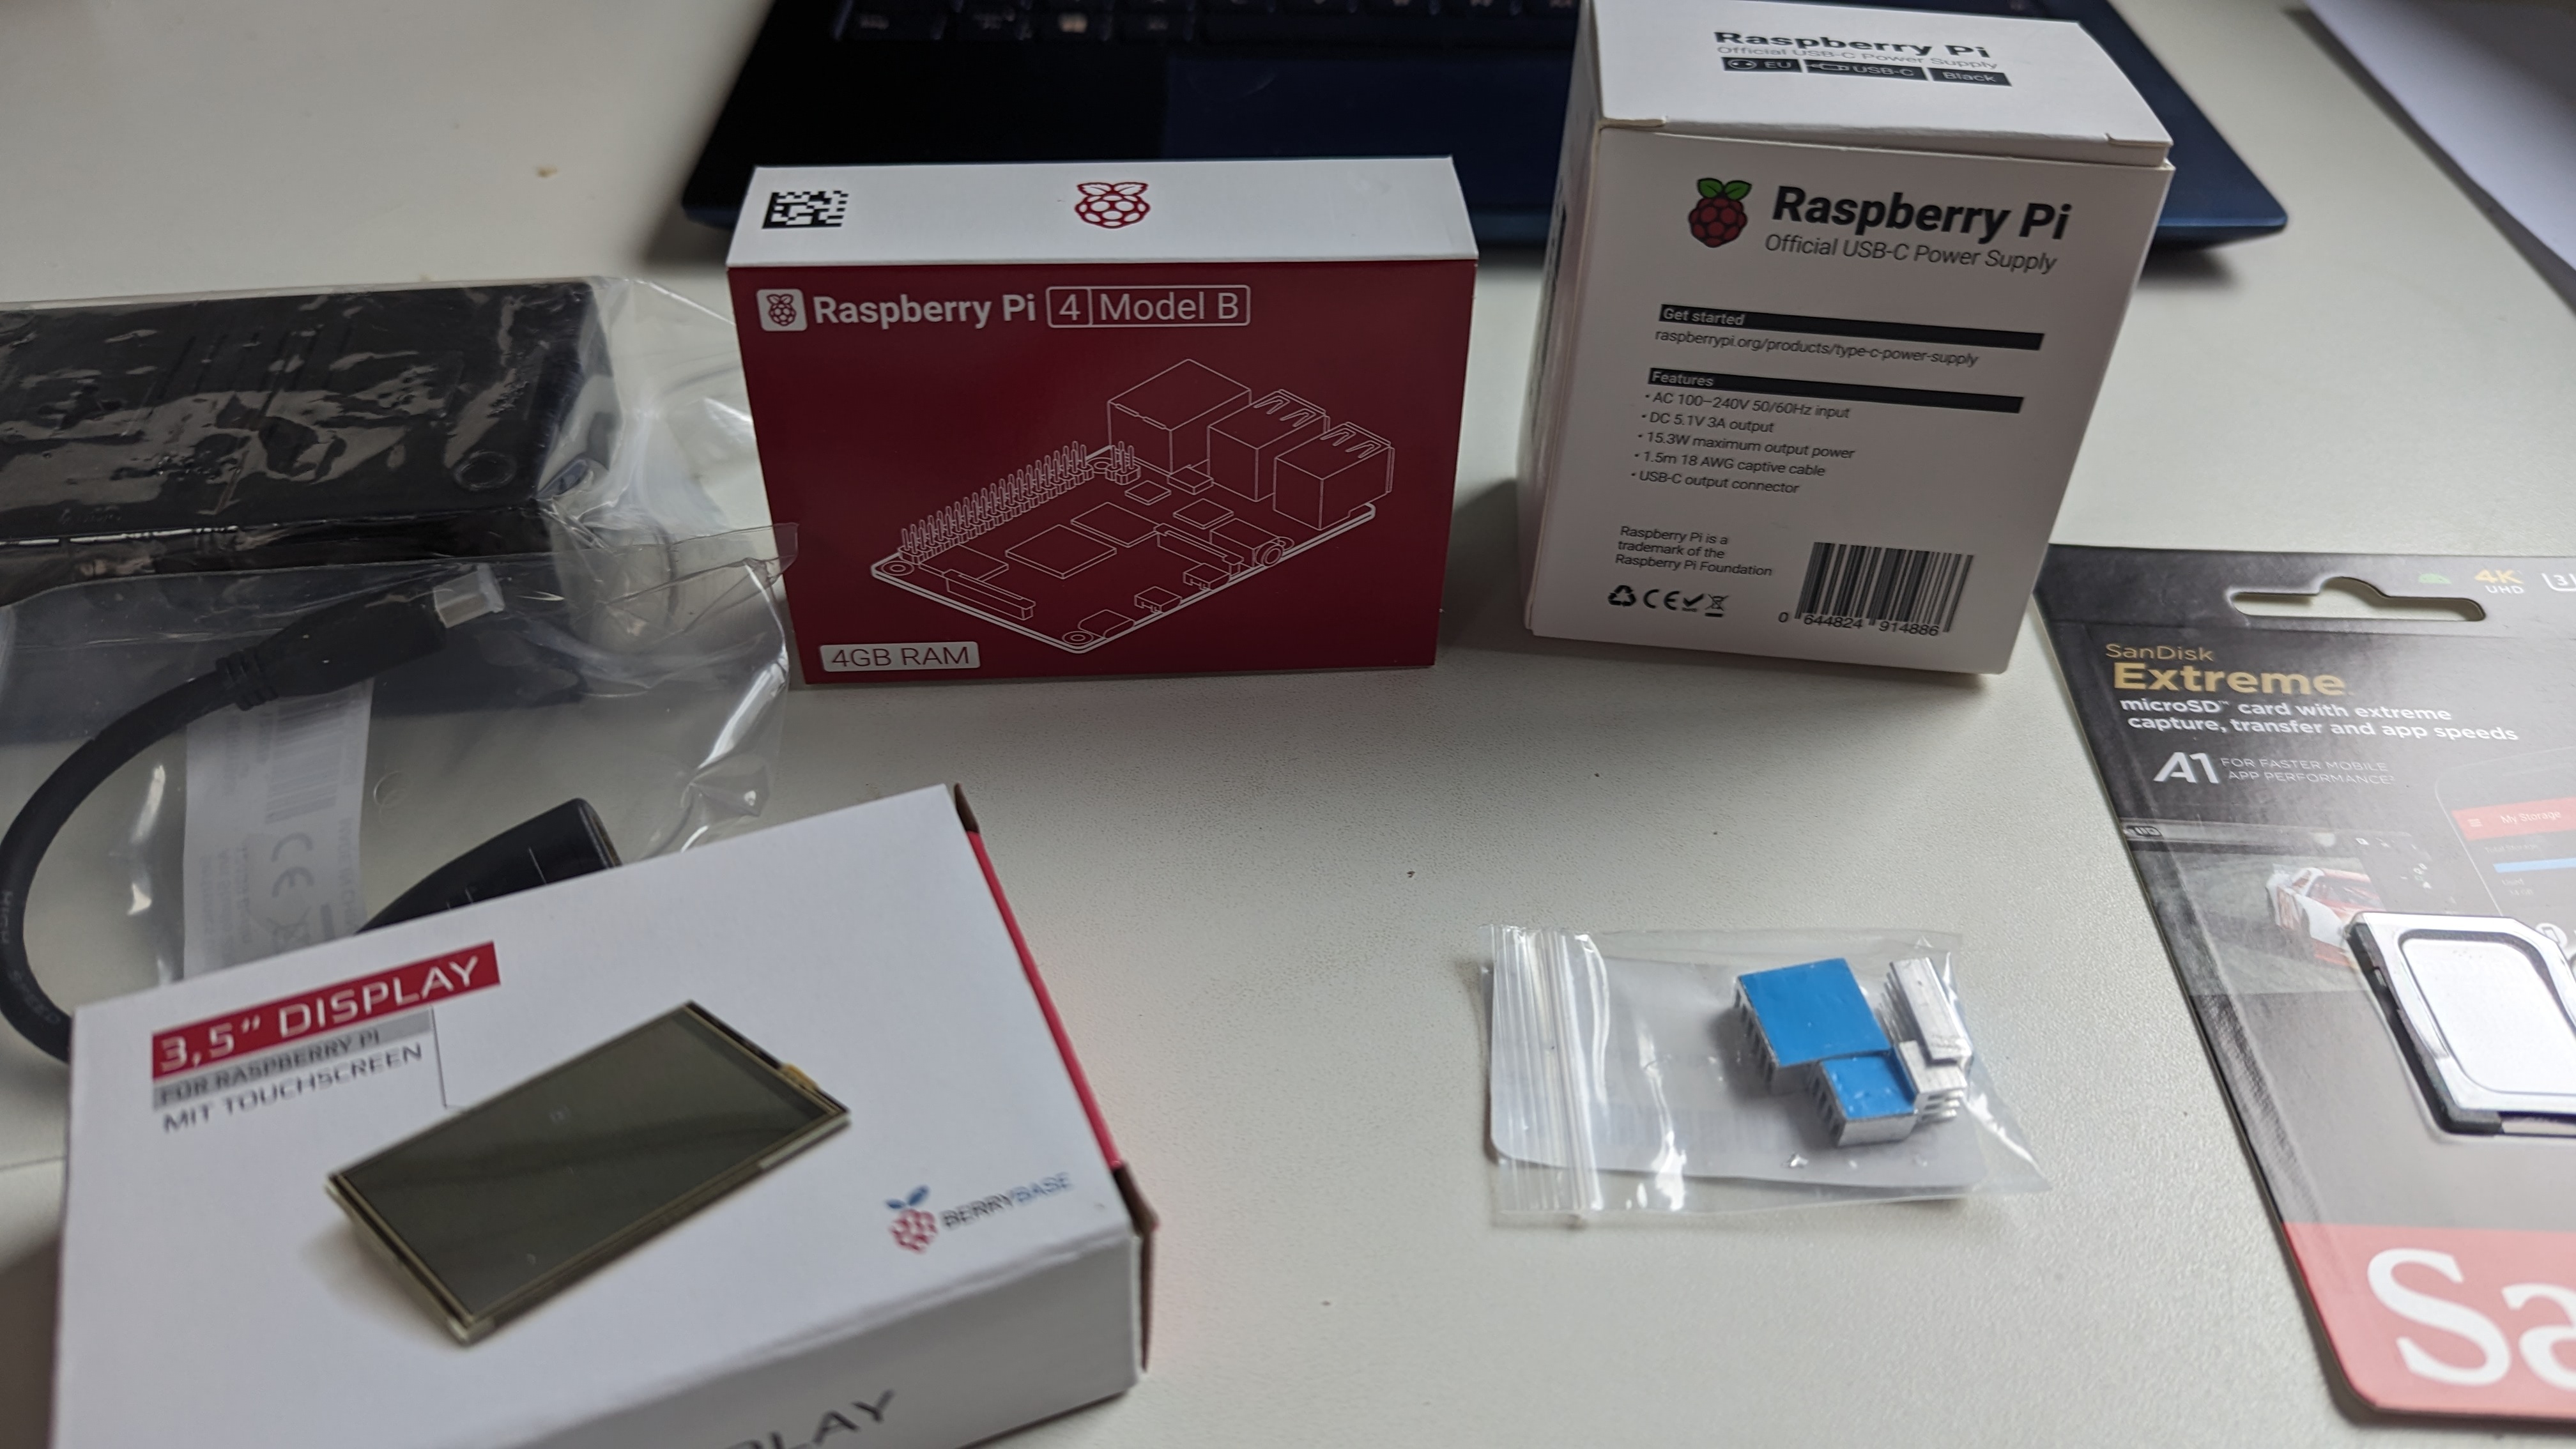
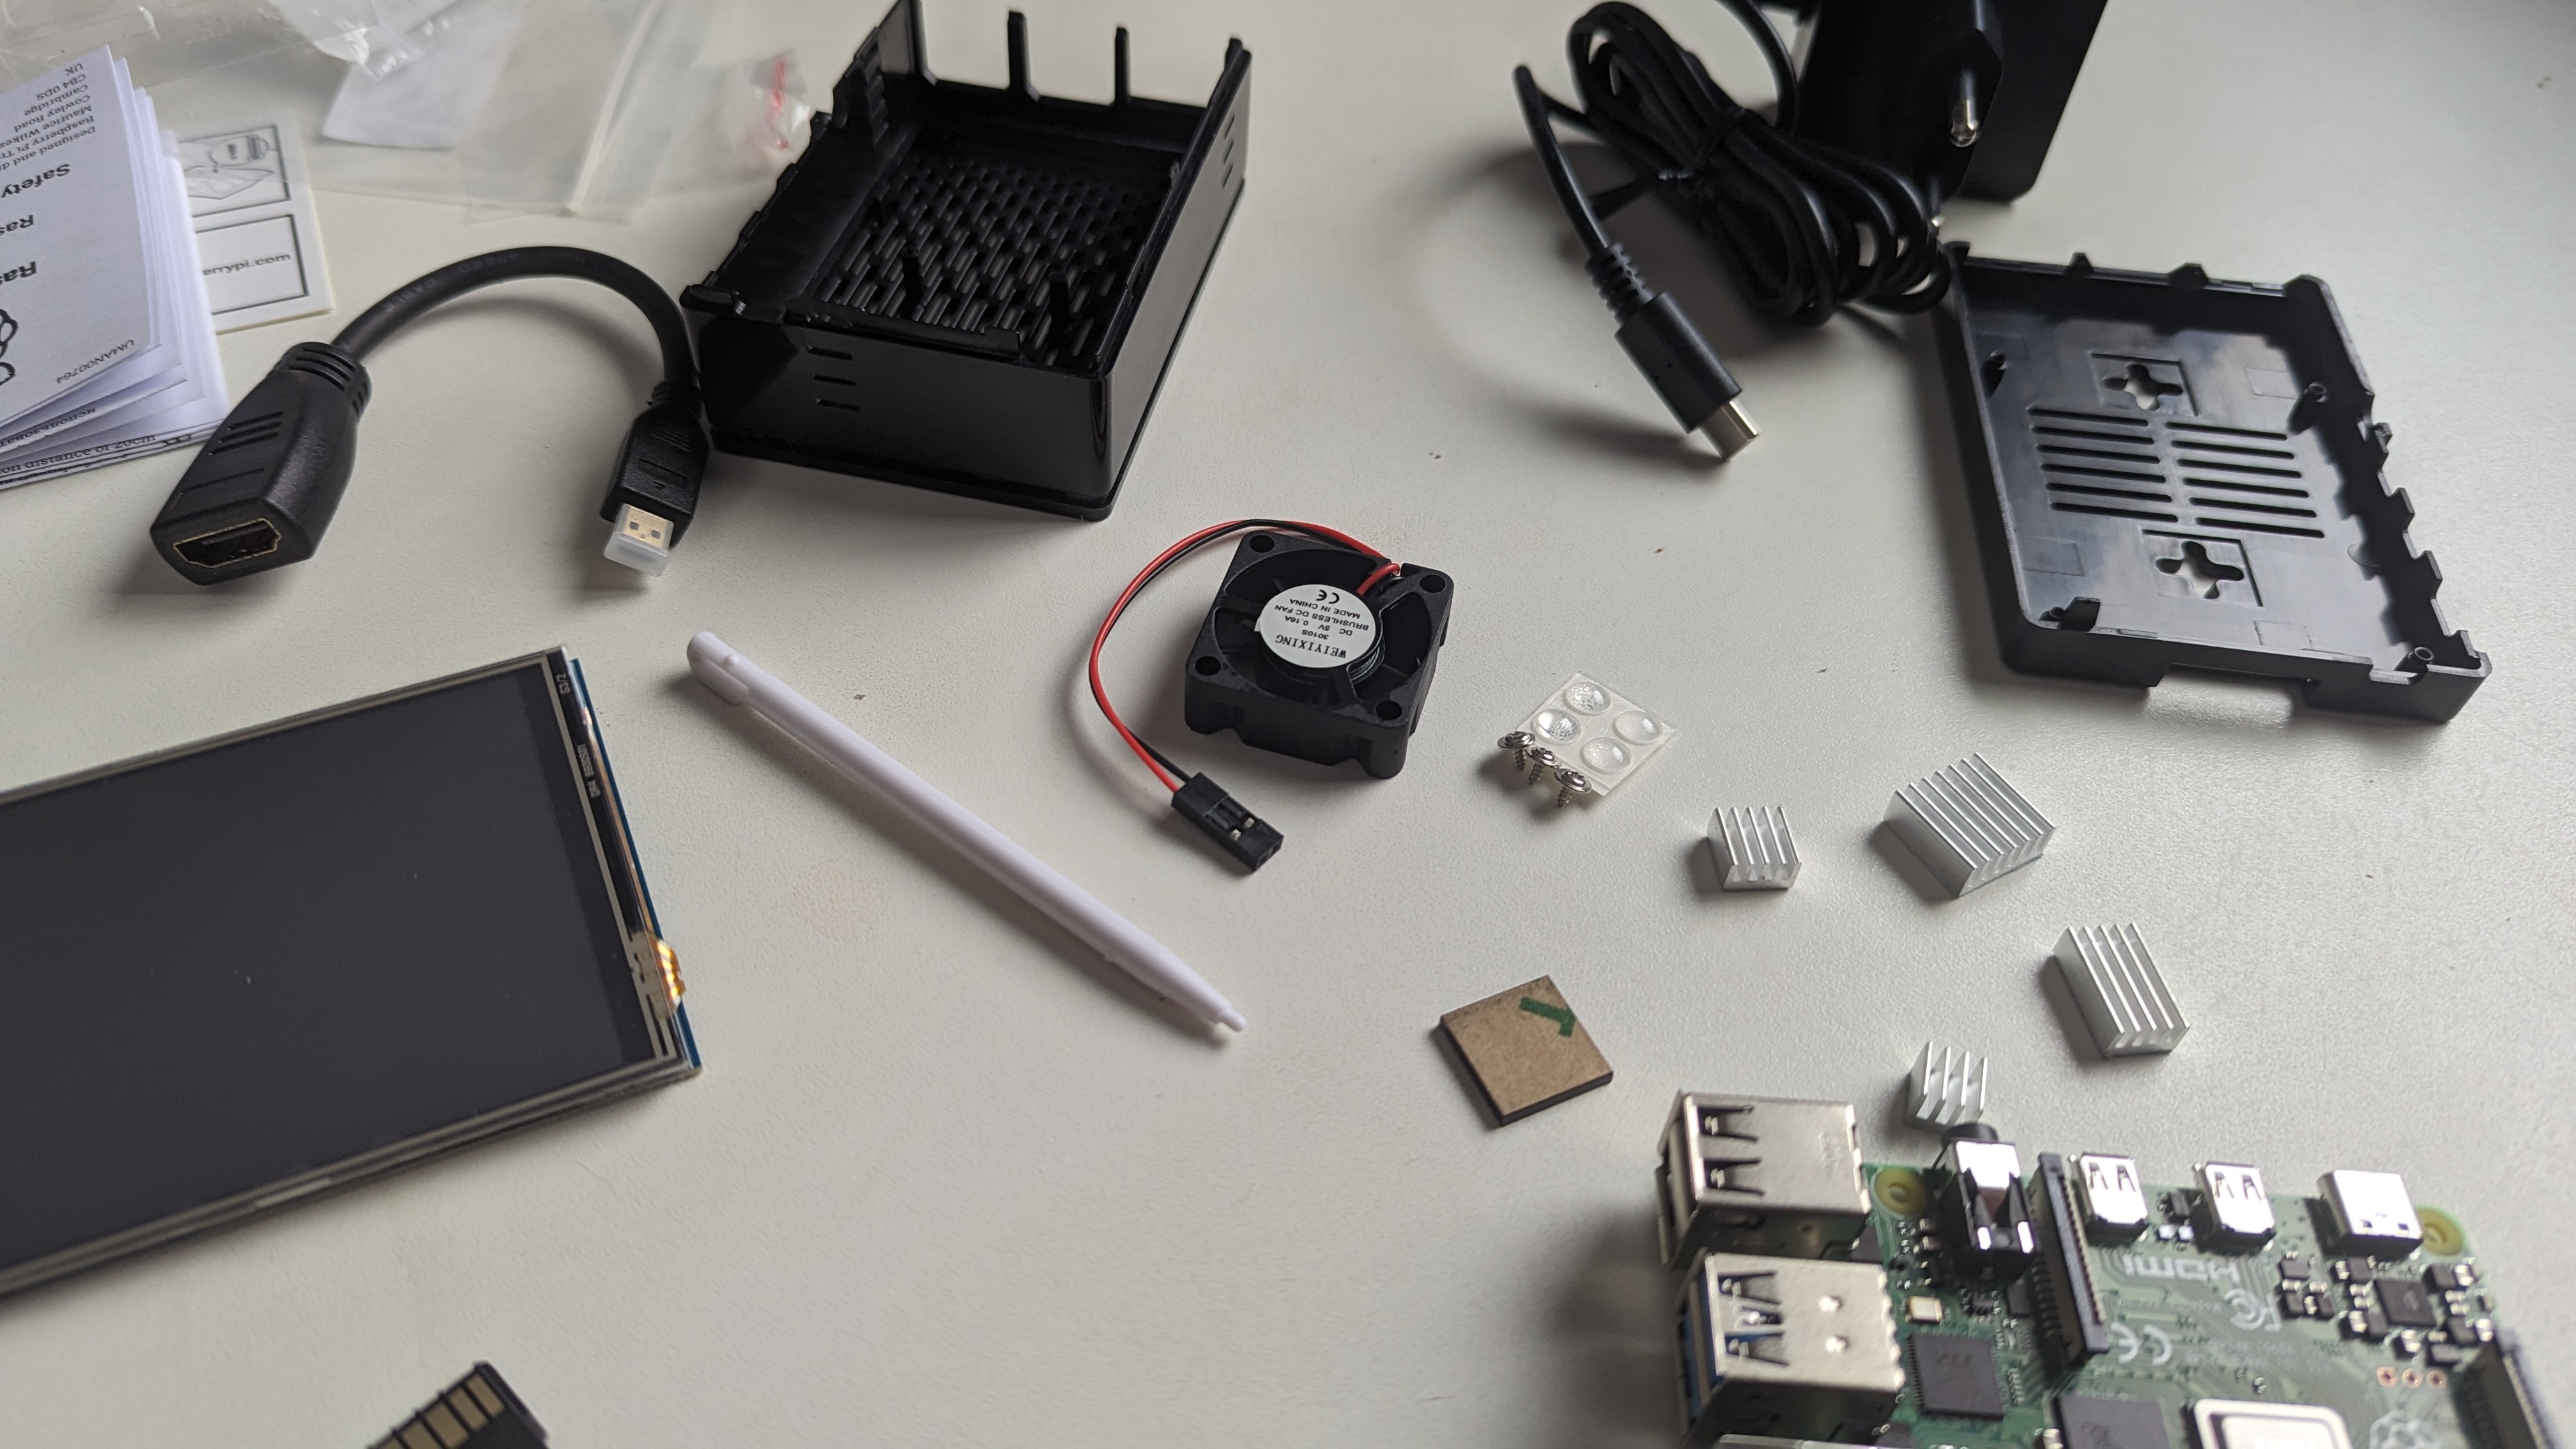
Energy ampel hardware
we need:
- Raspberry 4 B 4GB Ram
- 3,5 Zoll LCD Display
- 32 GB SanDisk


Carbon-App
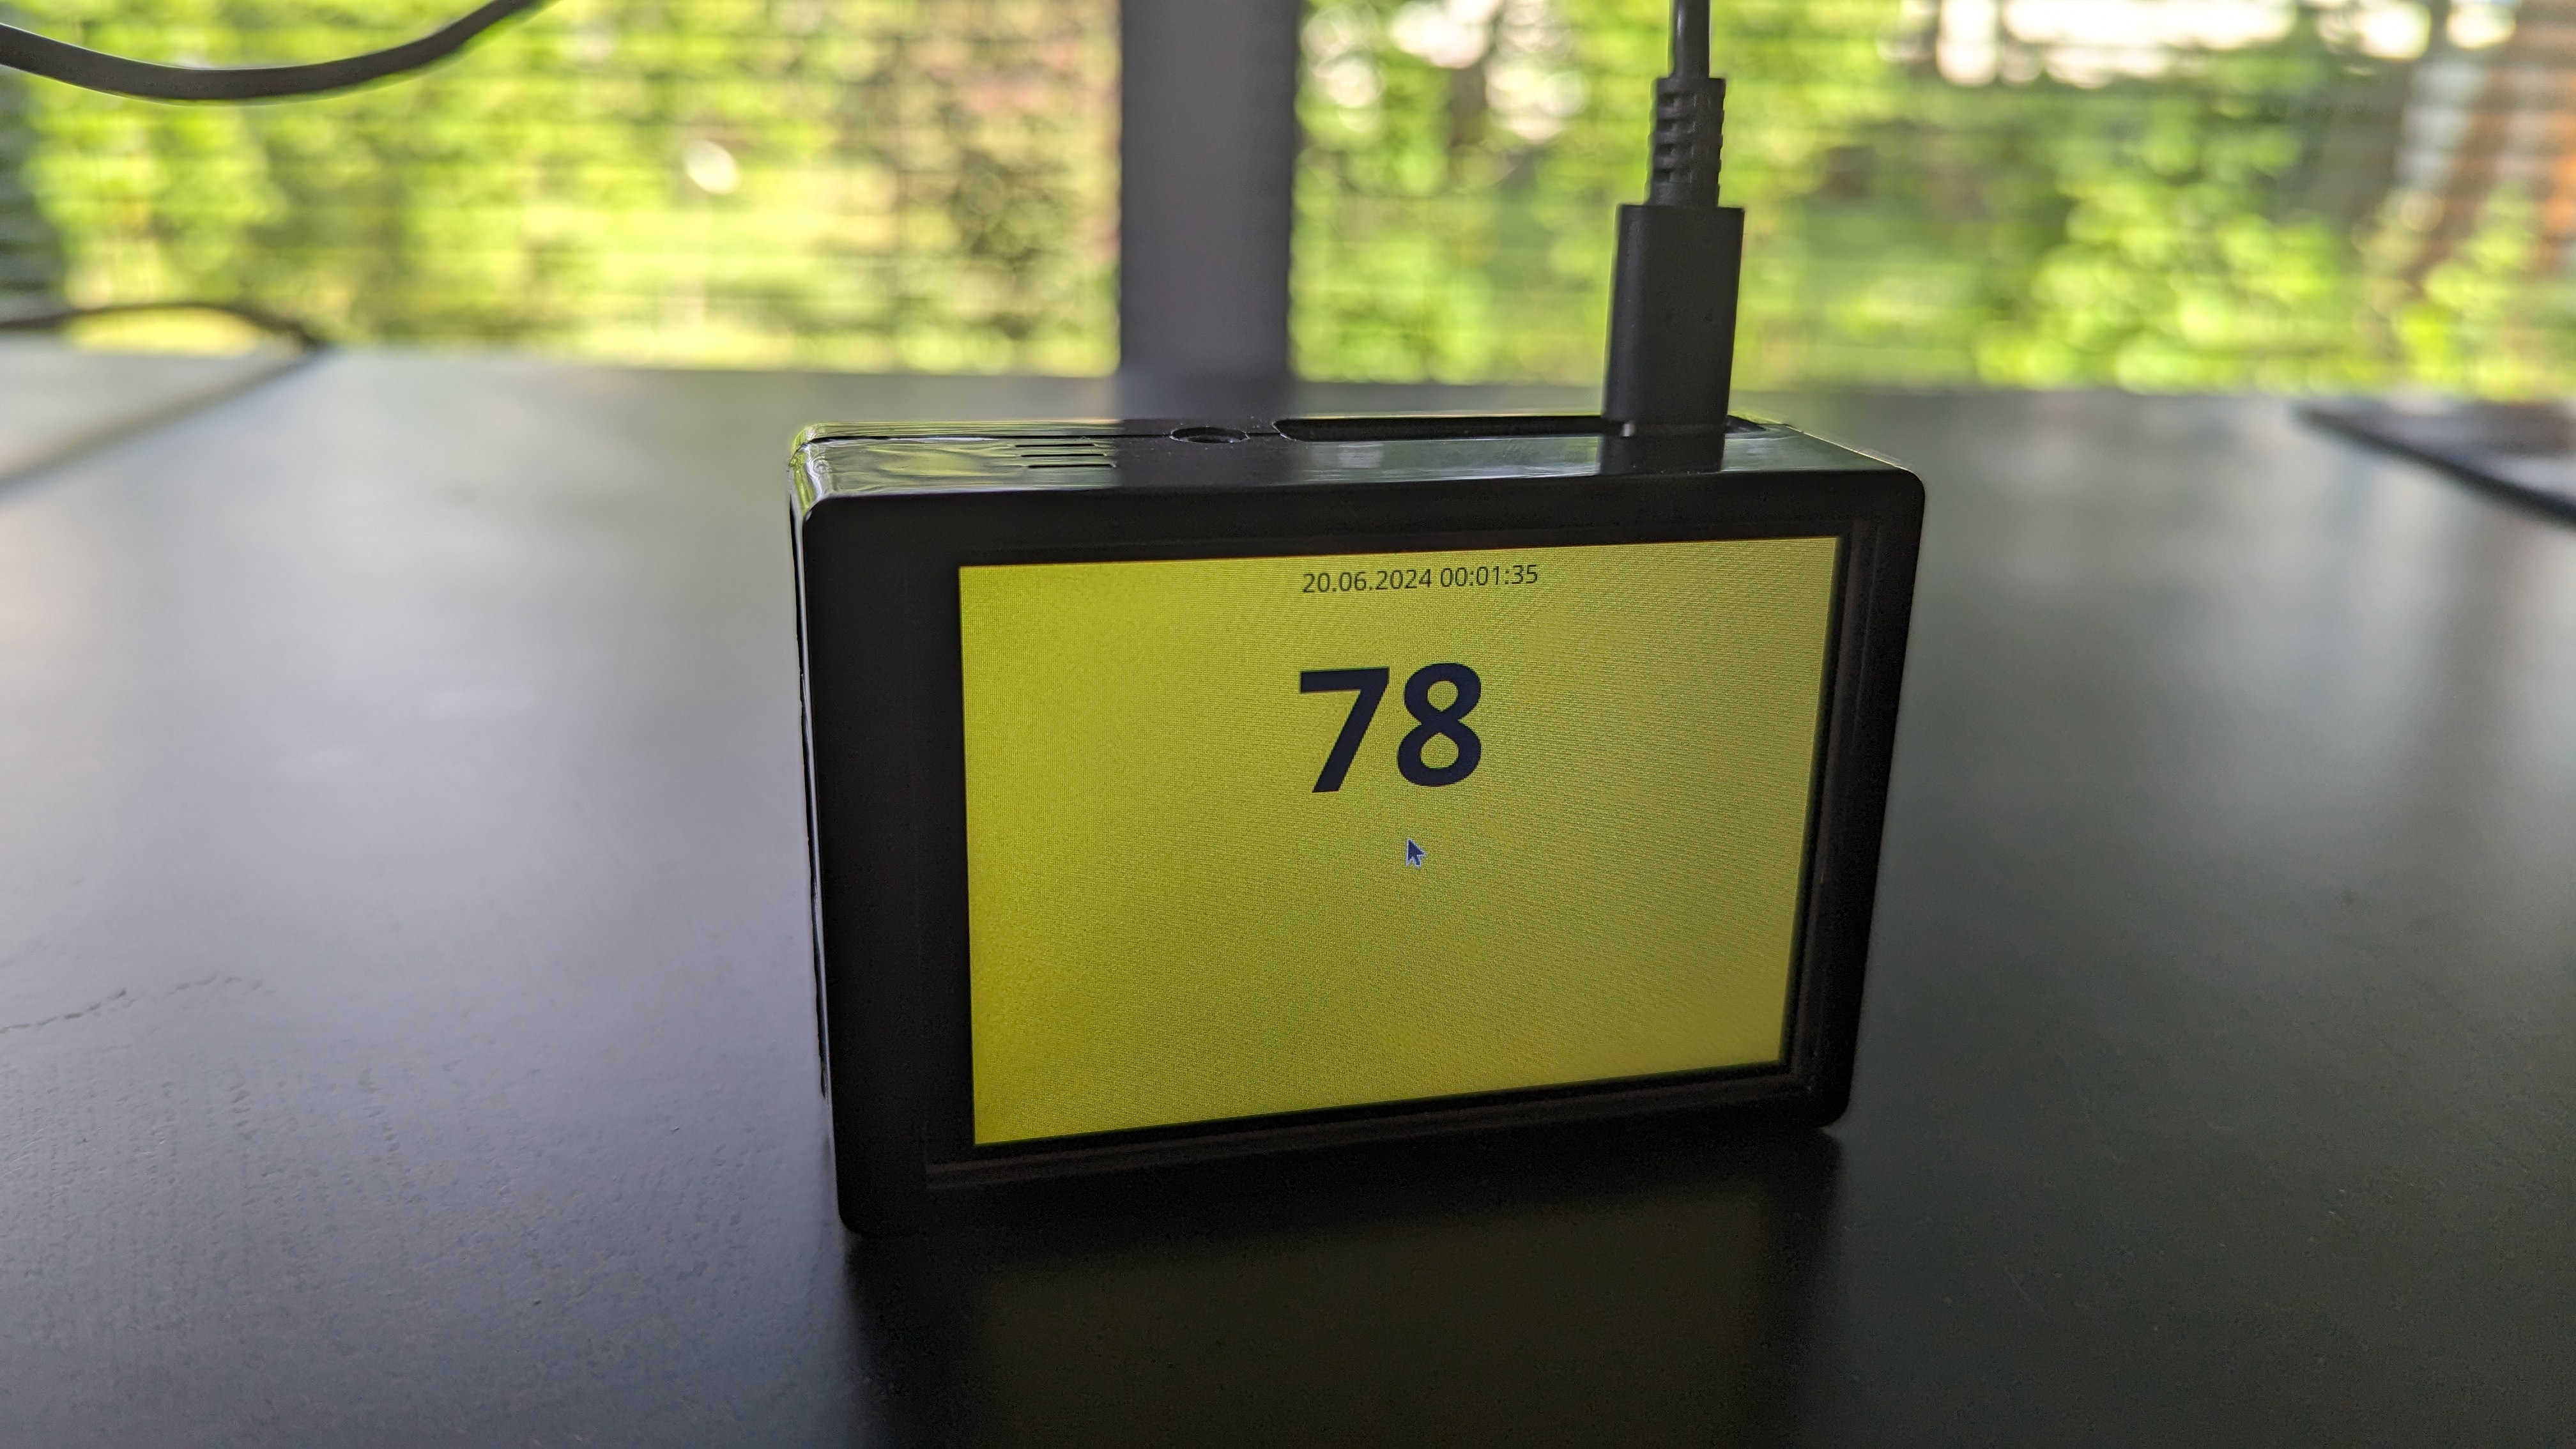
To show Prometheus metrics, there is Grafana. It’s a huge effort to run the completely kube-prometheus-stack on Raspberry. We only need ONE counter on a graphical overview, because the LCD display is not so big. We only need three colors on the display: red = low eco energy, yellow = a little eco energy, green = good eco energy, like a energy ampel.
This task fullfilled the Carbon App, a Go application, which started cross-plattformed a window (needs at list X on Linux) and displayed the color there. In the background Prometheus is queried, the environment variable PROMETHEUS_URL pointed to the endpoint. Since version 0.0.20 the app runs in full screen mode and has no other configuration options as the Prometheus URL and the query timer.
Energy ampel software (Fast Track)
For the fast track we have a running Prometheus elseqhere, which provides the metric with the eco energy in Germany in realtime.
Dependly on the used LCD-Display you can find here ready to used images for Raspberry, where the LCD display is configured. Otherwise you need addtional configuration (see below). I choosed the MPI3501-3.5inch-ubuntu-mate-22.04-desktop-armhf+raspi.img. You can copy the image with USB disk writer on a flash card and put this in the Raspberry. After the boot X starts automatically with auto login as user pi. We need network settings for WIFI if you don’t use LAN connect. Finished!
Now we need the start after booting the Carbon-App. We connect with the Raspberry via ssh and crate the following file:
ssh pi@<raspberry-ip>
mkdir -p /home/pi/.config/autostart/carbonapp.desktop
/home/pi/.config/autostart/carbonapp.desktop
[Desktop Entry]
Name=Carbonapp startup commands for LightDM session
Type=Application
NoDisplay=true
Exec=/home/pi/bin/autostart.sh
X-Ubuntu-Gettext-Domain=lightdm
This has the Lightdm display manager in X:
cat /etc/X11/default-display-manager
/usr/sbin/lightdm
Now we create another file:
mkdir /home/pi/bin/
/home/pi/bin/autostart.sh
#!/bin/sh

wget https://github.com/eumel8/carbon-app/releases/download/0.0.20/carbonapp-arm.tgz
tar xvfz carbonapp-arm.tgz
rm -f carbonapp-arm.tgz
export PROMETHEUS_URL=http://<prometheus-server>
./carbonapp
We have a 32 bit operating system, but there are app version for amd64 and arm64, needs to adjust for your box. Look at the Release page.
For the Pometheus server we need an endpoint for the metrics, i.e. 127.0.0.1:9090
Now make the file executable:
chmod +x /home/pi/bin/autostart.sh
For the Raspberry there is the behavior of the sleep mode for the display after 30 minutes caused by the power management. This can be changed in the X Overview: Apps-Powermanagement, Sleep Display: none
The Gnome setting can be verfified in Gnome database as pi-user.
sudo su -
dconf read /org/mate/power-manager/sleep-display-ac
The second issue is the screensaver. Here you can install:
apt install xscreensaver
and choose in the configuratin menu Disable Screen Saver.
Deinstall all other screensaver:
apt purge mate-screensaver
Also remove configuration for unattended upgrade:
rm /etc/apt/apt.conf.d/50unattended-upgrades
You may set date/time/timezone with raspi-config, reboot, ready. After this it looks like this:

Energy ampel software (The hard way)
For the longer way we install Ubuntu One from https://ubuntu.com/download/raspberry-pi. We setup WIFI, User, timezone manually.
Install the driver for the LCD-Display:
apt update
apt install git cmake g++ curl
snap install helm --classic
git clone https://github.com/lcdwiki/LCD-show-ubuntu
cd LCD-show-ubuntu
./LCD35-show
After reboot the display stream should redirected to the LCD-Display. The setup program has also a backup/restore feature. It can be deinstalled and the normal display stream should back appear.
Noe the screen can be calibrated:
apt install xinput-calibrator
There are some howtos available:
- (https://www.waveshare.com/wiki/3.5inch_RPi_LCD_(A)
- xrandr
- xinput_calibrator
Depends of course on the used display type.
Now we create the auto start file:
~/.config/autostart/kiosk.desktop:
[Desktop Entry]
Type=Application
Exec=autostart.sh
Hidden=false
NoDisplay=false
X-GNOME-Autostart-enabled=true
Name[en_US]=carbon-kiosk
Name=firefox
Comment[en_US]=
Comment=
The auto start programm:
/home/pi/bin/autostart.sh
export KUBECONFIG=/home/pi/.carbon.kubeconfig
kubectl -n carbon wait --for=condition=available deployment carbon-grafana
# use pre-installed firefox browser in kiosk mode
firefox --kiosk http://10.43.2.152/d/carbonstation/carbon-station?orgId=1&refresh=5m
# OR download https://github.com/grafana/grafana-kiosk
# install chrome browser with: apt install chromium-browser
# and use this line instead firefox:
#/usr/local/bin/grafana-kiosk --URL http://10.43.2.152/d/carbonstation/carbon-station?orgId=1 --kiosk-mode tv
There are two option. One is Firefox with Grafana-Kiosk, which is based on Google Chrome.
Now we install K3S:
sudo curl -sfL https://get.k3s.io | sh -
If you don’t want to use admin credentials for the kiosk app, we can create a user in Kuberntes, see this howto
If the Kubernetes cluster is runnung, we can install the Carbon Footprint App:
snap install helm --classic
git clone https://github.com/eumel8/carbon-footprint.git
cd carbon-footprint
export KUBECONFIG=/var/lib/rancher/k3s/server/cred/admin.kubeconfig
helm -n carbon upgrade -i carbon . --create-namespace --set entsoe.entsoe_api_key=xxxx --set grafana.adminPassword=carbon-station
Please read the install instruction of Carbon Footprint App, especially the Entsoe-API-Keys.
With kubectl -n carbon get services you get the Service IP of Grafana and can adapt the autostart.sh.
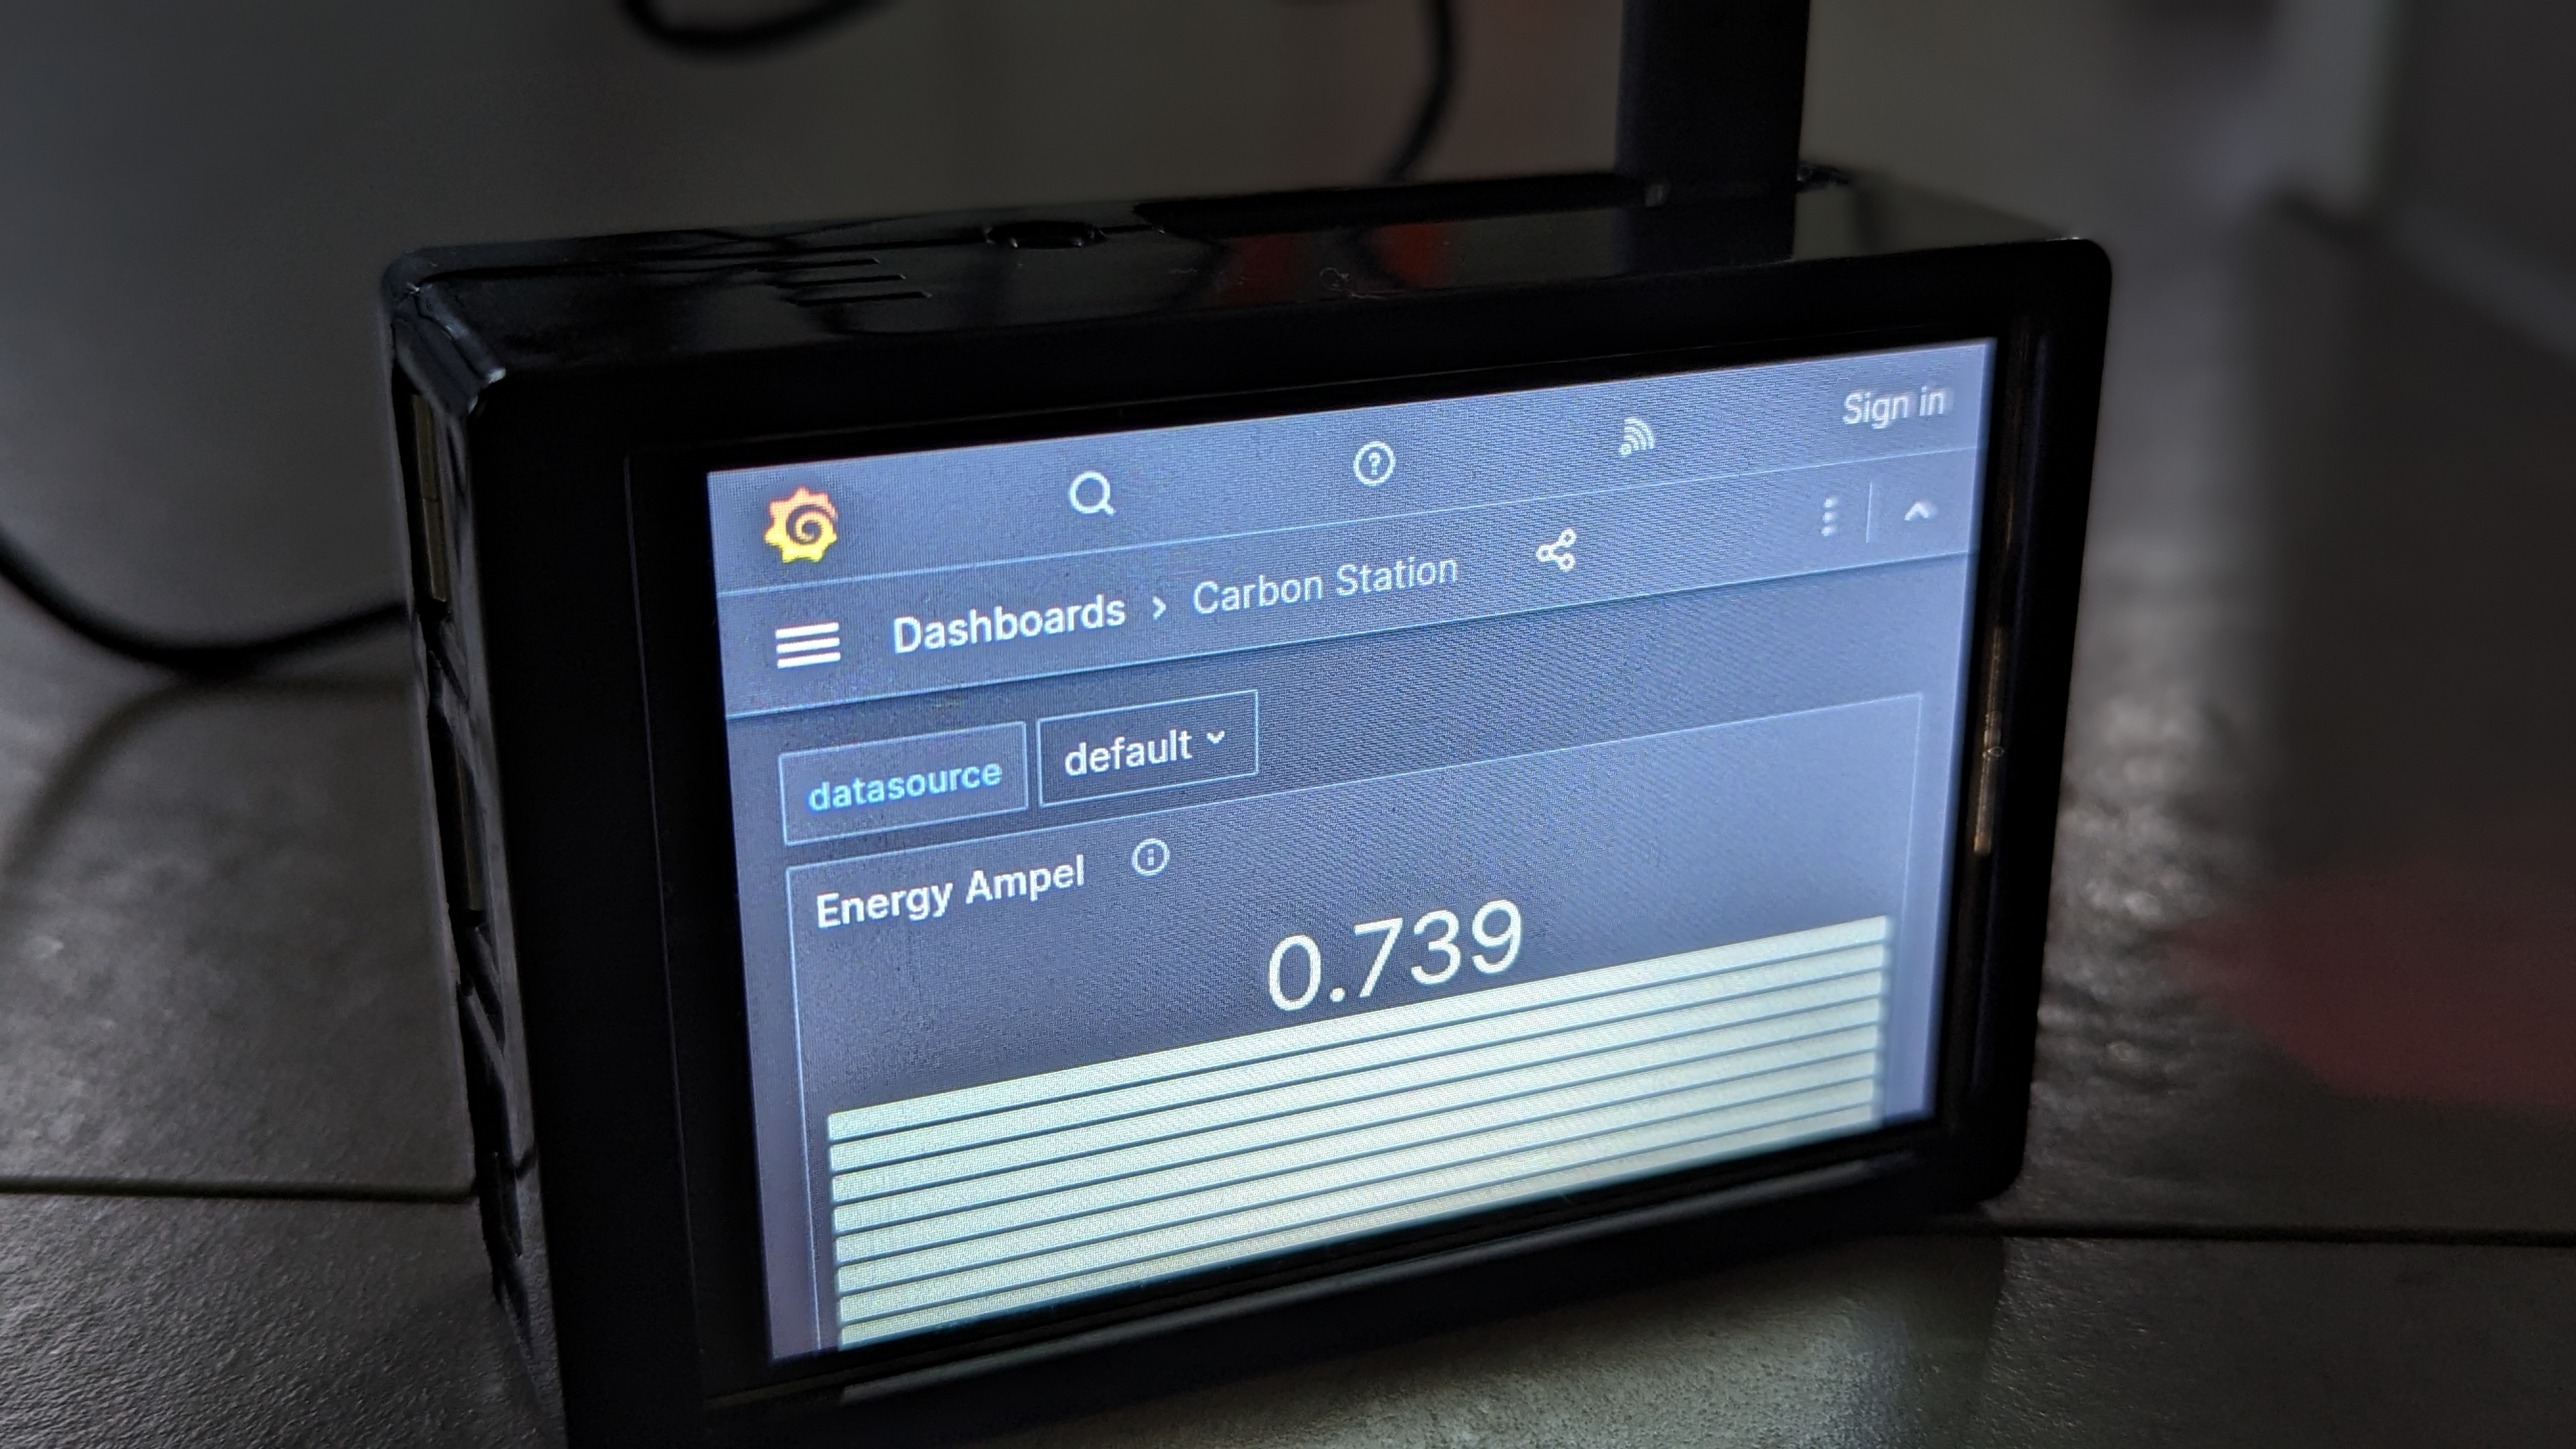
After this and the next reboot, K3S is starting, within Prometheus/Grafana backend services are available and Prometheus/Chrome in kiosk mode in a dashboard the eco energy and an ampel is displayed:

Just to not it requires more then 4 GB of Ram to operato K3S, Prometheus, X, and Firefox Browser on the Raspberry.This needs more resources. Additionally there are problems with auto refresh, otherweise the display is static. Also the displayed values are small, the dashboard in kiosk mode looks not correct and the display is not easy to read.
Best thing to drop the browser part and used the Carbon-App like described in the Fast Track section. As PROMETHEUS_URL wie use the service endpoint for Prometheus in carbon namespace of our clusters.
Target reached
I have visible information about the proportion of green electricity in real time, for example in the utility room or kitchen. This value currently only exists across Germany, but in the future it will work by city/street/house number and I can adjust my energy consumption to the times when green electricity is generated.
Happy Planet!